|
News
|
By Anjuli Deb -- With deep sadness and profound appreciation, we share the passing of LCG's founder, Dr. Rajat K. Deb. He was our president and one of the first entrepreneurs in the computer revolution. He was also our friend, our teacher and mentor, and for a few of us, our father and grandfather.
Read more
|
|
LCG, July 27, 2026--Ameren Missouri, a subsidiary of Ameren Corporation, today announced plans to build the West Alton Energy Center, a combined-cycle natural gas-fired facility. The 2,100-MW power generation facility is designed to provide reliable, around-the-clock baseload power for customers while keeping costs low. Ameren anticipates a completion date of 2031, pending regulatory approval.
Read more
|
|
|
Industry News
Snapshot of Load Changes, California (CAISO) and New York City regions (NYISO NYC): an Addendum
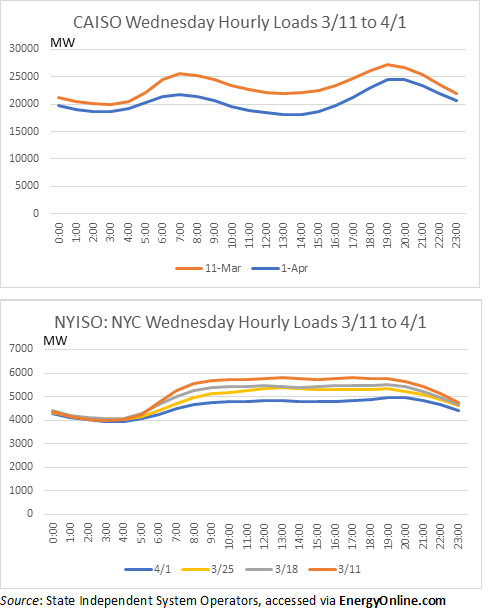
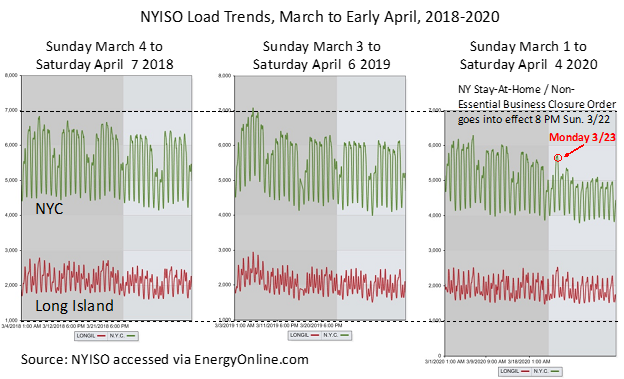
LCG, April 6, 2020 -- Jeremy Platt, Palo Alto has made some additional observations of impact of COVID - 19 on electricity demand using the grid operators data published by LCG. This note extends the results reported on March 27, 2020. The magnitudes of load reduction are very different due to the different sizes of these regions, but the times and scales of sharp reductions of ~ 16% are remarkably similar. No attempt has been made to isolate impacts due to COVID-19 measures from other complications such as weather. Nevertheless, as shown over three years for New York (NYC), stay-at-home policy impacts are highly transparent.
I. Hourly Load Profiles:
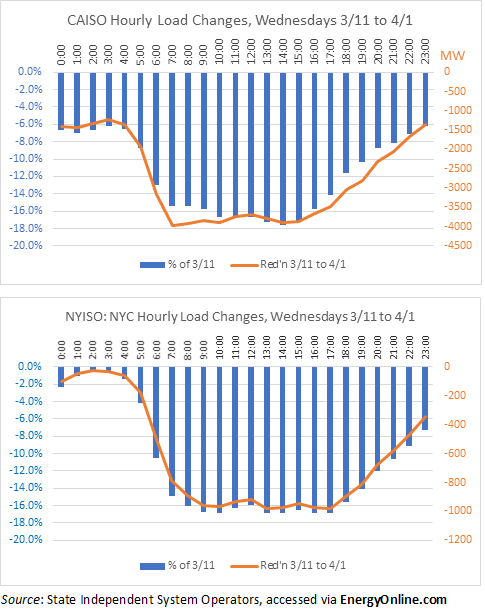
II. Load Reductions in MW and as Percent of Earlier (March 11) Load:
III. COVID-19 Response Shown for New York City Is Nothing Like Prior Experience
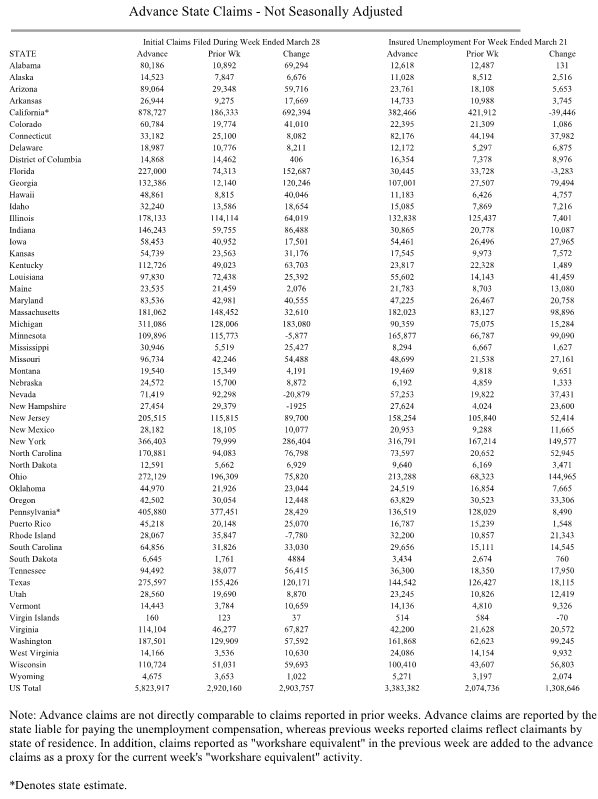
IV. Record Jump in Advance Claims for Unemployment Insurance
The economic impacts across the country of widening measures to reduce exposure to the novel coronavirus was evidenced for the second week in a row by surging claims for unemployment insurance. The back to back news releases from the Department of Labor on March 26 for the week ending March 21 and April 2 for the week ending March 28 present a sobering progression. Total advance claims – not seasonally adjusted – climbed from 251,416 to 2,898,450 (then revised to 2,920,160) to 5,823,917, the most recent total representing an almost exactly doubling from the prior record week. The number of states with more than 100,000 filings climbed from 10 to 17, with three more nearly at that threshold. Effects are notable nearly everywhere, the South, Southeast, and Mid-Atlantic states, major industrial centers of the Midwest, along the Gulf, e.g. Texas, and the earliest and hardest-hit areas of the Northwest and Pacific, namely Washington and California. All can be expected to show significant declines in industrial and commercial electric loads.
The Appendix incorporates a table from DOL’s latest news release “Unemployment Insurance Weekly Claims”:
https://www.dol.gov/sites/dolgov/files/OPA/newsreleases/ui-claims/20200551.pdf The week before, top filings were submitted in Pennsylvania (377,451) and California (186,333). A week later, seven states exceeded California’s number, in order: CA, PA, NY, MI, TX, FL and WA. 14 states were in, or approaching, the range down to 100,000, led by MA, IL, NC, IN and GA.
Recommended: A informative timeline and sampling of the growing impacts of the COVID-19 pandemic on business is the April 4 2020 Wall Street Journal article “The Month Coronavirus Felled American Business” by Liz Hoffman and Marcelo Prince.
Appendix: Dept. of Labor Unemployment Insurance Filings, Page 5 of April 2 News Release
|
|
|
|
UPLAN-NPM
The Locational Marginal Price Model (LMP) Network Power Model
|
|
|
UPLAN-ACE
Day Ahead and Real Time Market Simulation
|
|
|
UPLAN-G
The Gas Procurement and Competitive Analysis System
|
|
|
PLATO
Database of Plants, Loads, Assets, Transmission...
|
|
|
|
|