|
News
|
LCG, July 19, 2024 – A working paper published by the U.S. Energy Information Administration (EIA) utilized the UPLAN model to study the impact of high renewables growth in the Western Electric Coordinating Council (WECC) markets.
Read more
|
|
LCG, October 10, 2023 – LCG Consulting (LCG) has released its annual outlook of the ERCOT wholesale electricity market for 2024, based on the most likely weather, market, transmission, and generator conditions.
Read more
|
|
|
Industry News
An Update on the Impact of COVID-19 on Regional Electricity Loads
LCG, April 14, 2020 -- Jeremy Platt, Palo Alto - This update extends the topic addressed the week before to include PJM, ERCOT, MISO, SPP, CAISO, and NYISO. The magnitudes of load reduction are very different due to the different sizes of these regions, but the times and scales of reductions are remarkably similar. No attempt has been made to isolate impacts due to COVID-19 measures from other complications such as weather.
1. THE PJM REGION (Regional Transmission Organization): Mixed Bag, Industrial Regions Show Significant Changes

(PJM.com: Selected zones highlighted: Commonwealth Edison (Chicago area), Ohio Edison (N. Ohio) and Dominion (E. Virginia into part of N. Carolina)
A. PJM Impacts Begin to Emerge Week of March 22
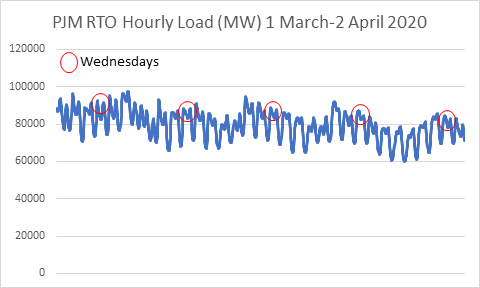
Source: PJM data
B. PJM Adjustments Made Principally by Natural Gas and Coal Generation
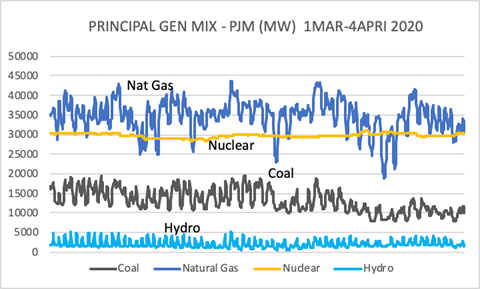
Source: PJM data
C. PJM Morning Load Shift Evident by March 25, Load Dropoff by April 1
Based on Wednesday to Wednesday comparisons, by March 25 the morning peak load is flatter and delayed by 2 or 3 hours. A week later, total midday to evening load has declined by up to 7% from several weeks before.
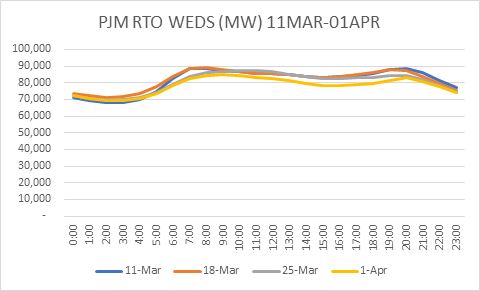
Source: PJM data
D. Deconstructing PJM to its Largest Zones Reveals Sharp but Conflicting Impacts
The largest shares of generation within the PJM RTO are COMED (the balancing area formerly controlled by the Chicago utility Commonwealth Edison), OE (Ohio Edison in northern Ohio), and DOM (Dominion, principally Virginia). The COMED and OE zones in northern and western parts of PJM along the Great Lakes appeared to operate largely in sync during this March to early April period. Dominion, along the Mid-Atlantic, shows a pattern of increasing load, without yet breaching to lower levels than experienced in early to mid-March.
COMED Zone: 13-14% Afternoon Decline between March 18 and 25, then Stable While this decline is significant, definitive conclusions cannot be drawn without accounting for possible weather effects. The shift in morning peak is evident.
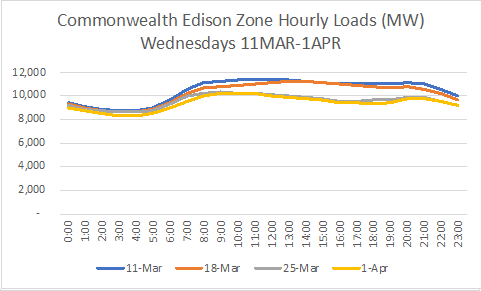
Source: PJM data
OE Zone: ~14% Late Afternoon/Early Evening Decline between March 18 and 25. The morning load shift and both morning and full day load declines are sharper than observed in COMED.
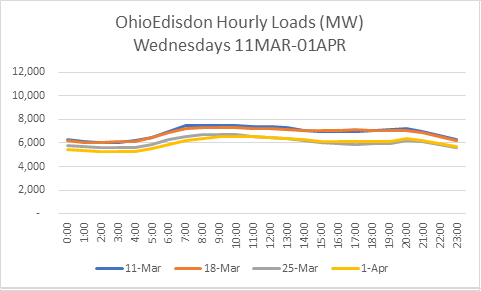
Source: PJM data
DOM Zone: Load Declines Not Evident (Yet), Yet Morning Peak Delayed, Flattened In this Mid-Atlantic region, load climbs over most of the period under examination, thus countering and muting somewhat the results seen across the entire PJM RTO.
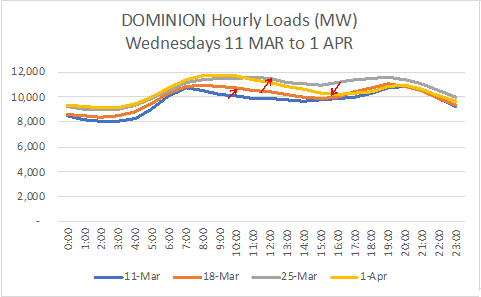
Source: PJM data
2. TEXAS (Electric Reliability Council of Texas) UPDATE: No Evident Load Decline, but Shape Appears to Shift Slightly by Last Week of Period
At first glanced (first chart below) the overall loads for the weeks at the beginning and end of the period are quite similar; in other words, changes in total demand appear to be muted so far. On the other hand, the latest week shown here, that of March 29, indicates a replacement of a sharp morning peak by a more gradual buildup of demand. This is more apparent in the week-to-week comparison in the second chart below. It is probably too early to conclude if this load-shifting will be sustained as a feature of reduced commercial and industrial loads and we cannot yet see a significant decline in overall load. This observation is based on an admittedly crude review of unadjusted data on actual loads.
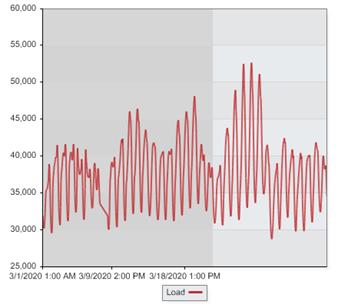
Source: ERCOT, Data Accessed via EnergyOnline.com
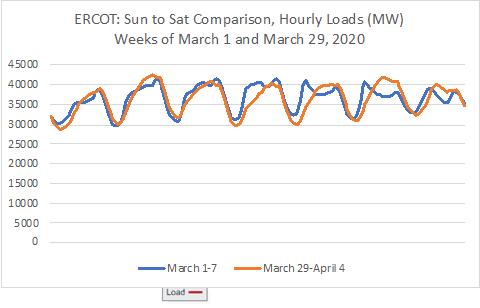
Source: ERCOT, Data Accessed via EnergyOnline.com
The Gold Standard of Analysis. A more sophisticated examination of load impacts of the coronavirus response has been provided by ERCOT itself, e.g. “COVID-19 Load Impact Analysis”, presentation by Calvin Opheim, ERCOT’s Manager of Load Forecasting & Analysis, April 7 2020.
http://www.ercot.com/content/wcm/lists/200201/ERCOT_COVID-19_Analysis_FINAL.pdf He observed minor to modest load changes beginning the week of March 22. By inputting actual weather into ERCOT’s load forecasting model, the difference between observed loads and this model calculation indicates the extent of impacts due to the current health crisis. The results are quite similar to those seen above, namely little change in daily peaks, 6-10% lower loads in just the earlier hours (6-10:00 AM), and overall only a 2% reduction in “energy use”. So far, it appears ERCOT’s analysis is one-of-a-kind, as we have not found similar weather-adjusted analyses by the other RTOs/ISOs.
3. MISO (Midcontinent Independent System Operator): Growing Load Declines
Map: This region with a vast climate range from Canada to the Gulf of Mexico extends from some of the earliest states to enact stay-at-home measures (e.g., Minnesota and Illinois) to some of the regions being hit hardest recently by COVID-19 cases (Louisiana) and economic/jobs impacts (Michigan and Louisiana).

(Source: misoenergy.com)
Examining load trends over the five-plus weeks since March 1, loads are beginning to drift lower toward the end of the fourth week (week beginning March 22). PJM’s calculations of “actual minus forecast” data are also reported and charted here. These illustrate a heightened negative bias that same week, with what appear to be some aberrations occurring earlier. Daily forecasts were routinely anticipating higher levels of load than occurred in real time,
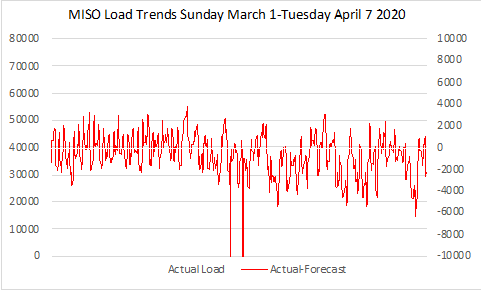
Source: MISO data accessed via EnergyOnline.com
A closer understanding comes from daily comparisons. Measured over Wednesdays since March 4 to April 1, loads initially climbed (though the 7AM loads declined consistently after March 4). Since March 18, loads fell throughout the day, and by April 1 had declined substantially. Maximum declines occurred between Noon and 5:00 PM. The starting point makes a difference in the accounting, thus the decline since the 11 March was about 10-11% but, measured against the higher load of March 18, it was about 13-14.5%, most of this occurring in the immediate prior week (e.g., March 25 to April 1). While these declines are about the same order of magnitude as those in parts of PJM (Chicago or northern Ohio), the severity of declines was delayed about a week.
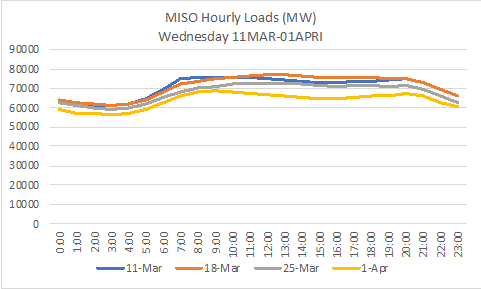
Source: MISO data accessed via EnergyOnline.com
4. SPP (Southwest Power Pool): Slight Load Decline in Latest Weeks, Perhaps
Map: This region is really a misnomer, as the SPP occupies the Great Plains extending principally from North Dakota directly south to Oklahoma and the Texas Panhandle, sweeping in parts of other states (a relatively small area of New Mexico lies in the true Southwest).

(Source: SPP.org)
By April 8, changes in load shape are not discernable and declines in load, particularly from about 11 to 3 pm, appear to be quite limited. Declines over the 3 weeks before April 1 averaged about 7.5% or 2,000 MW between 9 AM and 5 PM. It is not clear what role weather may have played over this time. Whatever may be occurring, it appears that a heat wave overwhelmed any other phenomena on the last Wednesday. Notably, climate factors are quite variable in SPP, just as they are in MISO and PJM. Temperatures in representative cities underscore this point. Loads in Nebraska and to SPP’s interties to the north, e.g. to the eastern part of the Western Area Power Authority, experienced little change from the norm on April 8, even decreasing, while loads over most of the rest of SPP shot up.
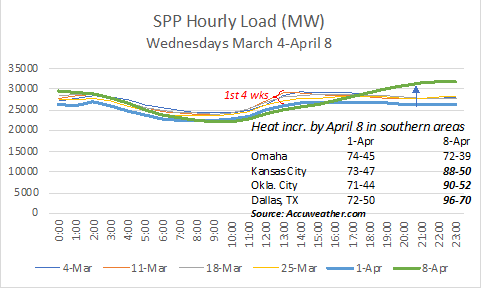
Source: Data obtained from SPP
5. CALIFORNIA (CAISO) Update: Stabilizing?
The snapshot provided here delves into the daily load patterns for the two largest utility systems in California, Pacific Gas and Electric and Southern California Edison. We have given little effort to acquiring hourly load data from Los Angeles Water and Power which would likely be informative due to the stringency of stay-at-home measures taking place there.
A Wednesday to Wednesday comparison for CAISO, PGE and SCE is made in the following charts, concentrating on the most recent three weeks March 25, April 1 and, updating prior comments, April 8. The declines previously seen by April 1 have either lessened or been erased by April 8. The more granular view of individual companies shows a perhaps significant midday increase in load in SCE, with a further shift or broadening, i.e. increase, from 8 AM to 2 PM
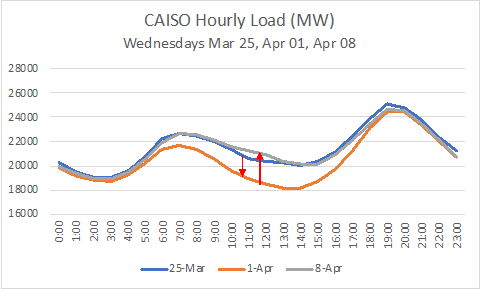
Source: CAISO, Data accessed via EnergyOnline.com
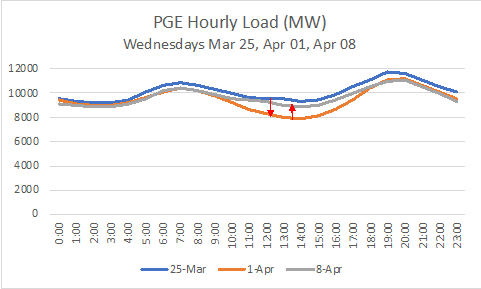
Source: CAISO, Data accessed via EnergyOnline.com
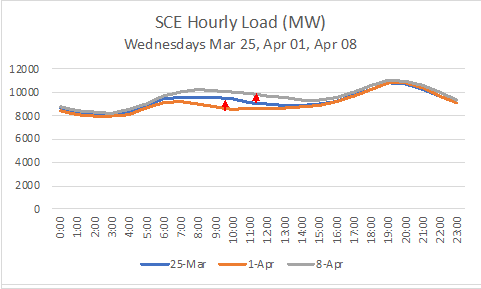
Source: CAISO, Data accessed via EnergyOnline.com
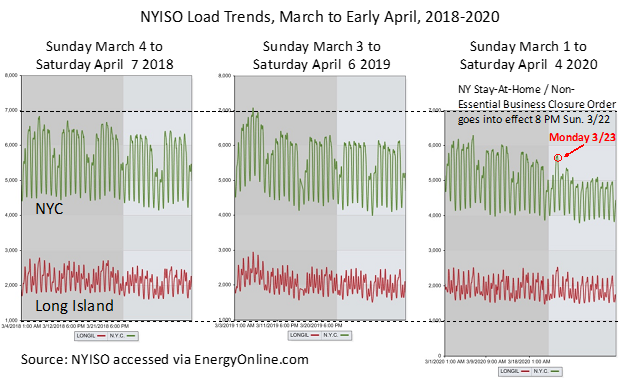
6. New York (NYISO)
A. Hourly Load Profiles:
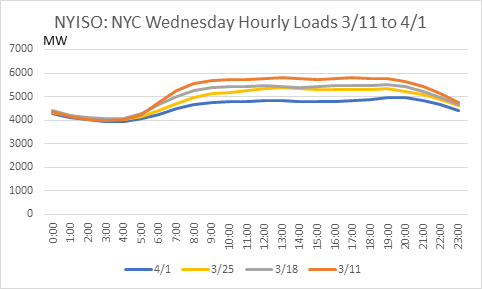
Source: State Independent System Operators, accessed via EnergyOnline.com
B. Load Reductions in MW and as Percent of Earlier (March 11) Load:
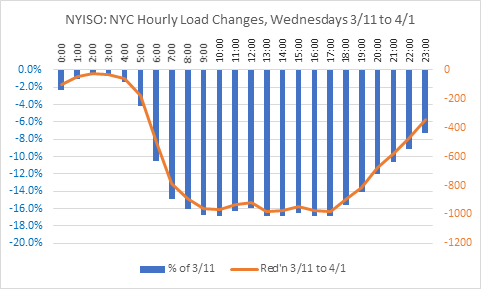
Source: State Independent System Operators, accessed via EnergyOnline.com
C. COVID-19 Response Shown for New York City Is Nothing Like Prior Experience
|
|
|
|
UPLAN-NPM
The Locational Marginal Price Model (LMP) Network Power Model
|
|
|
UPLAN-ACE
Day Ahead and Real Time Market Simulation
|
|
|
UPLAN-G
The Gas Procurement and Competitive Analysis System
|
|
|
PLATO
Database of Plants, Loads, Assets, Transmission...
|
|
|
|
|